
Cursor
@cursor_ai
Coding agent for building ambitious software
加入 August 2023
39 正在关注 498.8K 粉丝
The first chart usually raises the next question.
Ask it in the same chat and /visualize answers with a new chart.

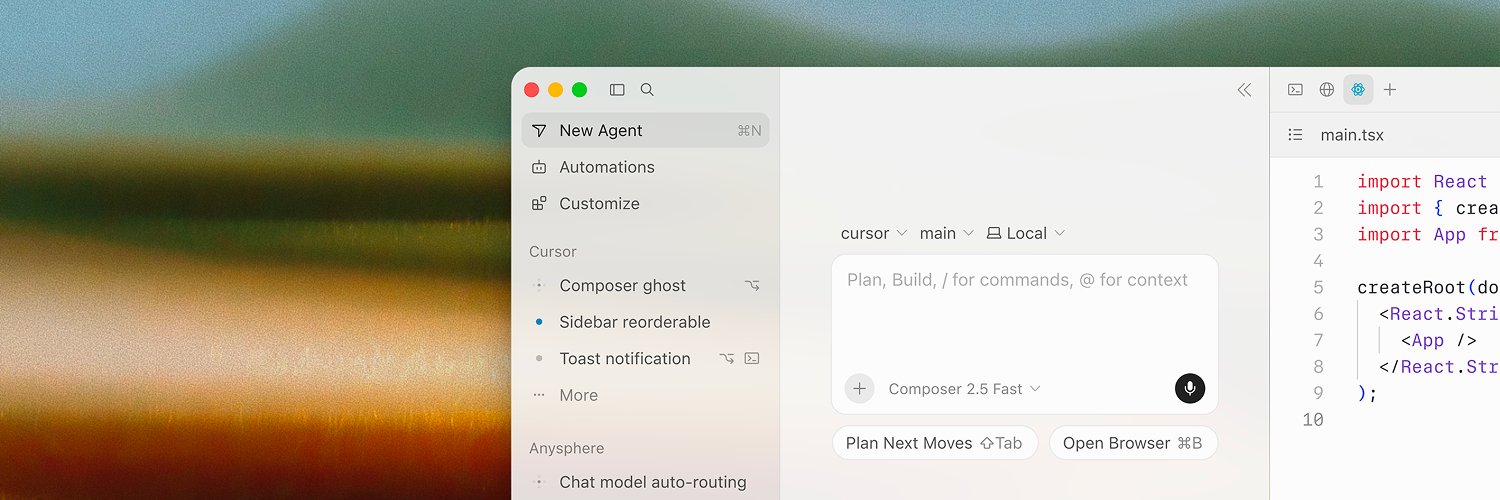
Cursor can now build charts and diagrams right in the chat.
Use /visualize to analyze data and see the answer inline. Available now in the Agents Window.




