

Discretionary Trading
@dcretofficial
Up to $8M trading capital. Based on merit.
Bridging the gap between skill and institutional capital.
351 Following 6.2K Followers
A thermometer can be perfectly accurate and still tell you almost nothing about whether you should go outside.
It measures temperature.
It doesn’t measure rain, wind, sunlight, or what you’re wearing.
The instrument isn’t wrong.
The measurement is simply incomplete.
Trading data works the same way.
Win rate can be accurate.
Profit factor can be accurate.
Sharpe ratio can be accurate.
Yet none of them, alone, tells you what produced the result.
Two strategies can have identical returns and completely different underlying behavior.
One may depend on a few extraordinary trades.
Another may earn small gains consistently and occasionally suffer large losses.
Same headline number.
Different machine underneath.
The danger isn’t bad data.
It’s asking good data to answer a question it was never designed to answer.
Measurement is not understanding.
#Trading# #Statistics# #RiskManagement#
Show more

The exchange can close at a price nobody actually traded at.
Sounds impossible.
It isn’t.
In many markets, the official closing price isn’t simply the last trade of the day.
It’s often determined through a closing auction.
That distinction matters.
Imagine a stock’s final continuous market trade happens at $100.
Then the closing auction receives a large imbalance of buy and sell orders.
The auction can establish an official closing price of $101.
The last trade was $100.
The official close is $101.
Both numbers can be correct.
That’s because they answer different questions.
$100 Where did the continuous market last trade?
$101 At what price did the closing mechanism determine the market could match the remaining interest?
This matters far beyond curiosity.
Index calculations, portfolio valuations, performance reports and derivatives can depend on official closing prices.
So when you see
“The stock closed at $101.”
don’t automatically imagine someone bought it at $101 as the final transaction of the day.
The “close” isn’t always a moment.
Sometimes it’s a process.
And one of the most familiar numbers on a price chart…
isn’t necessarily the number you think it is.
Show more

A company can have a $500 stock and be worth less than a company with a $20 stock.
That sounds backwards.
Until you remember something most people forget
A share price isn’t a company’s value.
Suppose Company A has
10 million shares × $500
= $5 billion market capitalization
Company B has
1 billion shares × $20
= $20 billion market capitalization
Company B’s stock is 96% cheaper per share.
But the company itself is worth 4× more.
This is why saying:
“Stock A is expensive because it’s $500.”
doesn’t tell you much.
A company can split its shares 10-for-1 tomorrow.
The price becomes $50.
Nothing fundamental about the business changed.
The market capitalization didn’t magically become one tenth as large.
The ownership was simply divided into more pieces.
Yet traders routinely anchor on the number printed beside the ticker.
$20 feels cheap.
$500 feels expensive.
Neither tells you what the business is worth.
The price of one piece tells you almost nothing without knowing how many pieces exist.
Sometimes the first mistake in analyzing a market…
is assuming the number you’re looking at is the number that matters.
Show more

A trader can improve their win rate…
…and become a worse trader.
Suppose you take 100 trades.
You win 70.
You feel like you’ve solved the market.
Then you discover something uncomfortable
Your average winner is $50.
Your average loser is $200.
Your 70% win rate is losing money.
Now reverse it.
You win only 35 trades out of 100.
But your average winner is $400 and your average loser is $100.
Suddenly the trader who “loses most of the time” is the profitable one.
This is why win rate is such a seductive statistic.
It feels like a score.
It isn’t.
A trader can spend months trying to increase the percentage of trades they win…
while quietly destroying the economics of the trades they take.
The better question isn’t
“How often am I right?”
It’s
“What happens financially when I’m right and when I’m wrong?”
Because trading doesn’t reward accuracy in isolation.
It rewards the relationship between accuracy and payoff.
And sometimes the trader who looks least impressive on the scoreboard…
is the one with the better game
Show more

The trader who checks his P&L 20 times a day may know less about his performance than the trader who checks it once.
Because P&L answers only one question
What happened to the money?
It doesn’t tell you whether the money was earned through a repeatable process.
Consider two traders.
Trader A makes $8,000 this month.
Trader B makes $3,000.
At first glance, A looks better.
Now change the information.
Trader A took 42 trades, doubled his normal position size after a losing streak, and made most of the month’s profit from two unusually large winners.
Trader B took 18 trades, stayed within his normal risk parameters, and produced almost the same results across different market conditions.
Who had the better month?
The answer changes once you measure something other than the account balance.
That’s the problem with performance measurement in trading.
The most visible number isn’t necessarily the most informative number.
A brokerage statement can tell you what your decisions produced.
It can’t tell you whether you should trust those decisions again.
That requires a different record.
Not just
How much did I make?
But
What kind of trader did those results require me to become?
Show more

A trader can lose money on a trade they never entered.
Not because of slippage.
Not because of leverage.
Because of opportunity cost.
Imagine two traders watching the same market.
Trader A sees no setup and stays in cash.
Trader B sees no setup, but enters anyway because “something has to happen.”
The market moves sideways for hours.
Trader B pays spread, commissions and potentially takes a loss.
Trader A loses nothing.
But here’s the interesting part:
Trader A can still make a mistake.
If the market later produces a high-quality setup and
A is mentally exhausted from waiting, distracted, or no longer paying attention, the cost of doing nothing wasn’t the trade.
It was what happened to the trader while waiting for it.
This is why inactivity isn’t automatically discipline.
Sometimes it’s patience.
Sometimes it’s avoidance.
Sometimes it’s simply indecision wearing a professional disguise.
The difficult question isn’t
Should I trade?
Its
What am I doing while I’m not trading?
Because waiting is also a decision.
And like every decision in markets…
it has an opportunity cost.
Show more

In 1979, Paul Tudor Jones learned a lesson that cost him almost everything he was managing.
He was trading cotton.
The position went badly.
Jones later recalled that the accounts he was managing lost roughly 60–70% of their equity during that period.
But the important part wasn’t the size of the loss.
It was what happened afterward.
Jones became much more focused on protecting capital and controlling downside.
That experience helped shape a principle that became central to his trading
You don’t need to make money every day.
You need to remain capable of trading tomorrow.
That’s easy to say after a loss.
It’s much harder when you’re watching your equity disappear.
And that’s why the most useful trading lessons aren’t always found in someone’s biggest winning trade.
Sometimes they’re found in the trade that permanently changed how they thought about risk.
A trader’s career is built from thousands of decisions.
But occasionally, one decision or one painful mistake changes the framework behind all the decisions that follow.
The loss is temporary.
The lesson can become permanent.
Show more

In 1990, Salomon Brothers found a way to push past a limit in the U.S. Treasury auction system.
The limit was 35%.
No single bidder could receive more than 35% of the securities offered to the public.
Then came the December 27, 1990 auction of $8.5 billion of four year Treasury notes.
Salomon bid $2.975 billion for itself exactly 35%.
But it also submitted an unauthorized $1 billion customer bid.
Combined:
46% of the entire offering.
The customer bid was ultimately transferred to Salomon.
And this wasn’t an isolated incident.
Salomon later admitted to unauthorized bids in five Treasury auctions between December 1990 and May 1991.
The scandal triggered investigations by the Treasury, SEC, Federal Reserve and Congress.
The SEC later alleged that Salomon had repeatedly submitted false bids to circumvent Treasury’s purchase limits.
Here’s the part traders should remember
A market rule doesn’t automatically create a level playing field.
The real game includes understanding
Who the rule applies to.
How it is calculated.
What counts as one bidder.
What happens when participants try to work around it.
That’s not a lesson about “breaking rules.”
It’s a lesson about market structure.
If you’re trading a market, don’t just learn its price patterns.
Learn the rules that determine how the game itself is played.
Show more

On September 16, 1992, Britain tried to defend a currency level the market no longer believed in.
The pound was inside the European Exchange Rate Mechanism (ERM), which required Britain to keep sterling within an agreed range against other European currencies.
But the UK economy was weak.
German interest rates were high.
And defending the pound increasingly conflicted with what Britain needed domestically.
Then came Black Wednesday.
Britain raised its minimum lending rate from 10% to 12%.
It announced another increase to 15% for the following day.
That 15% rate was never implemented.
By that evening, after heavy official intervention failed to lift sterling from its ERM floor, Britain suspended the pound’s ERM membership.
George Soros later revealed that he had bet roughly $10 billion against the pound and made nearly $1 billion when Britain abandoned the defense.
But the interesting lesson isn’t
“Soros shorted the pound.”
It’s this
He wasn’t simply betting that a currency would fall.
He was betting that the policy defending the currency had become unsustainable.
That’s a different way to think about markets.
Sometimes the important question isn’t
Where is price going?
It’s
“What has to remain true for this price to stay where it is?”
Because when a market price depends on a policy, peg, intervention or commitment…
the real trade may be in the credibility of that commitment.
That is where macro trading gets interesting.
Price is the visible number.
The policy behind the price can be the real trade.
Show more

The most dangerous number in a trading account may not be your loss.
It may be the amount your broker allows you to trade.
In futures, margin is not a down payment.
It is a performance bond.
You can control a much larger notional position with a relatively small amount of capital. CME notes that futures margin is typically only a fraction of the contract’s total value.
That creates a trap
Buying power can look like capacity.
It isn’t.
A broker may allow you to open a position.
That doesn’t mean your account can safely carry it.
CME explicitly advises traders to size positions according to risk scenarios not simply according to the maximum number of contracts their margin allows.
This distinction changes how you should think about leverage.
The question isn’t:
“How much can I trade?”
It’s
“How much exposure can I survive?”
Because the market doesn’t care what your broker permitted.
It only cares what your position is exposed to.
Maximum leverage is a limit imposed by the system.
Sensible leverage is a limit imposed by your judgment.
Those are not the same thing.
Show more

Do You can be right about the market…
and still be wrong as a trader.
Imagine buying a futures contract at 100 because your analysis says fair value is 110.
The market eventually reaches 110.
Your thesis was correct.
But first, price falls to 90.
Your position gets stopped out.
Then the market rallies to 110 without you.
So what were you?
Right?
Wrong?
Both?
That is the uncomfortable part of trading.
The market doesn’t grade your thesis.
It grades the position you actually held while uncertainty was unfolding.
A forecast tells you where price might go.
A trading plan has to account for everything that can happen before it gets there.
Price can move against you first.
Volatility can expand.
Liquidity can disappear.
Your assumptions can change.
Your capital can run out.
And sometimes the market reaches your target only after your position is gone.
That creates a distinction traders rarely discuss
Directional accuracy is not the same as tradeability.
You don’t get paid for eventually being right.
You get paid for staying in the game long enough for your thesis to have a chance.
So don’t only ask
“Where do I think price is going?”
Ask
“What can happen before it gets there and can I survive it?”
That is where a market opinion becomes a trading plan.
Show more

In 1968, the New York Stock Exchange had a problem that sounds almost impossible today.
It had too much trading.
Trading volume had risen dramatically, and the paperwork required to process trades, confirmations and delivery instructions began overwhelming the financial system. The SEC later described the period as the “Paperwork Crisis.”
The problem became serious enough that trading hours were curtailed.
Then came the extraordinary solution.
Starting June 12, 1968, the NYSE closed every Wednesday.
The Wednesday closures continued through the end of the year, giving brokerage firms time to work through their operational backlog.
And the problem didn’t disappear when Wednesdays returned.
On January 2, 1969, the exchanges went back to a five day week but trading hours remained restricted while the industry continued dealing with the crisis.
Think about what that means.
The market wasn’t running out of buyers.
It wasn’t running out of sellers.
The infrastructure processing the trades was struggling to keep up with the trades themselves.
That is a very different kind of market risk.
Today, traders think about speed in milliseconds.
In 1968, the bottleneck was paperwork.
The technology changed.
The underlying problem didn’t
A market can scale only as fast as the infrastructure supporting it.
And sometimes the most important part of a trade isn’t what happens when you press Buy or Sell.
It’s everything that has to happen afterward.
Show more

A risk control system can become a source of risk.
That sounds contradictory.
History says otherwise.
Before the 1987 crash, portfolio insurance used computer models to reduce equity exposure as markets fell, often by selling stock-index futures.
The logic was straightforward
Market falls
→ sell futures
→ reduce exposure
→ protect the portfolio.
But when many institutions followed similar rules during the same decline, those trades could add selling pressure to an already falling market.
The Federal Reserve later noted that portfolio insurance may have contributed to a feedback loop, while also emphasizing that it was not the only cause of the crash.
That distinction matters.
A strategy can be sensible for one participant…
yet produce very different consequences when thousands of participants respond to the same signal.
This is a risk traders often overlook
Your strategy does not operate in isolation.
Other traders have models.
Funds have mandates.
Risk systems have thresholds.
Margin rules can force decisions.
And when enough participants react to the same condition at the same time, their individual decisions can become part of the market’s behavior.
The market is not just a collection of strategies.
It is a system of interacting strategies.
That is where individual risk can become systemic risk.
Show more

Open interest is one of the most misunderstood numbers on a futures screen.
A market can trade millions of contracts…
and still have relatively little open interest.
Why?
Because volume and open interest measure different things.
Volume counts contracts traded during a period.
Open interest counts contracts that remain open after those trades.
Imagine two traders create a new futures position.
One buys.
One sells.
That creates 1 contract of open interest.
If they later close that position, open interest falls.
But if one trader exits while another new trader takes the other side, volume can increase while open interest may barely change.
That distinction matters.
Because traders sometimes look at rising volume and assume:
“More money is entering the market.”
That isn’t necessarily what the data says.
Volume tells you how much trading occurred.
Open interest tells you how many contracts remain outstanding.
Neither number, by itself, tells you whether price is going higher or lower.
But together, they can give you another view of what is happening beneath the price.
The chart shows where the market went.
Volume shows how much was traded.
Open interest shows how much exposure remains.
Three different pieces of information.
And confusing them can lead to a very different interpretation of the same market.
The lesson
Don’t just read price.
Understand what the numbers underneath the price actually measure.
Show more

The first price you see isn’t where price discovery begins.
Take the NYSE opening auction.
Before the regular session begins, orders are already entering the exchange.
Buy and sell interest accumulates.
NYSE publishes imbalance information during the
pre-open, including paired quantity and indicative pricing information.
Then the opening auction brings eligible orders together to establish the opening price.
That means the first trade isn’t simply
“Someone bought. Someone sold. That’s the price.”
It is the result of a process that has been developing before the opening print.
And the scale can be substantial.
During the first four months of 2024, NYSE said its opening auction averaged 44 million shares and $2.4 billion in traded value per day.
That’s why the opening price deserves more attention than simply being the first candle on your chart.
The candle shows you the result.
The auction shows you part of the process that produced it.
For a trader, that’s an important distinction.
Price is the final number.
Price discovery is everything that happened to determine that number.
Show more

Gold crossed $4,600 an ounce this week.
Then look at what central banks are doing.
China’s central bank bought another 20 tonnes in July.
That made it 21 consecutive months of reported purchases, the longest streak in the World Gold Council’s data.
Its official holdings reached about 2,366 tonnes.
Now look at the U.S.
On August 19, the Treasury announced that some
long term Treasury buyback operations would increase from $2 billion to at least $4 billion per operation.
Gold jumped more than 4% that day.
The Treasury market is roughly $32.2 trillion.
The buybacks are tiny beside it.
Yet the gold market reacted sharply.
There isn’t one explanation for the move.
Reuters points to several forces a weaker dollar, lower yields, technical momentum,
Treasury market liquidity expectations and renewed concern about U.S. debt and fiscal sustainability.
That combination is more interesting than any single headline.
Because gold isn’t producing earnings.
It isn’t paying a coupon.
And it doesn’t depend on a central bank keeping its promise.
Yet when uncertainty moves from “What will rates do?” toward “How much confidence should I place in the system?”, gold suddenly looks very different.
The oldest monetary asset in the world is trading in a market shaped by some of the newest financial problems.
Sometimes history doesn’t repeat.
It just becomes relevant again.
Show more

A trading strategy can become less reliable the more you try to perfect it.
Imagine testing a strategy on 20 years of historical data.
You notice that certain losses occurred before major reversals.
So you add a rule
“Don’t take the trade when this pattern appears.”
The results improve.
Then you find another losing pattern.
Add another rule.
The backtest improves again.
Repeat this enough times…
And eventually you can build a strategy that looks exceptional on the past.
But there is a problem.
You may have optimized the strategy for the data you already saw.
This is the basic danger of overfitting.
A model can become extremely good at explaining historical observations while becoming less useful on new data.
And trading makes this particularly dangerous because markets contain noise, changing regimes, and relatively few truly independent observations.
The more decisions you make after seeing the data, the easier it becomes to mistake coincidence for an edge.
So when a backtest gets dramatically better after adding one more rule, don’t only ask
“Did the strategy improve?”
Ask
“Did I discover something real or did I teach the strategy the answer to an exam it has already seen?
Show more

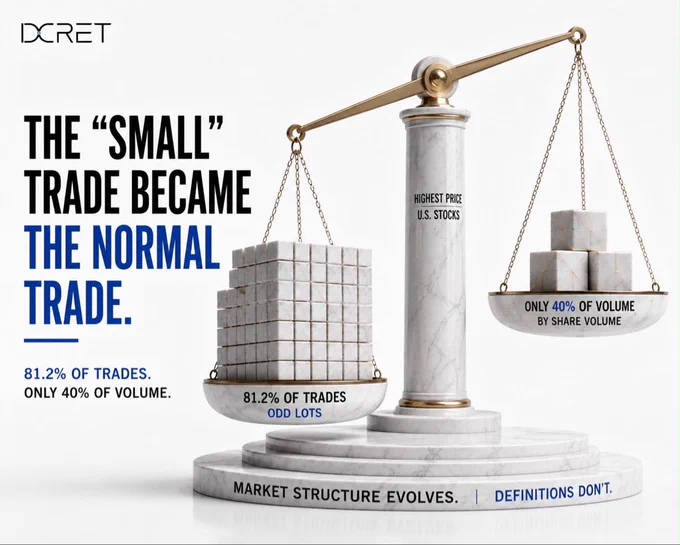
In 2022, more than 8 out of every 10 on exchange trades in the highest-priced U.S. stocks were odd lots.
81.2%.
The SEC found that in Q1 2022, odd lots accounted for 81.2% of on exchange trades in stocks in the highest price decile.
But by share volume, they represented only about 40%.
That sounds strange until you remember what an odd lot is
Generally, fewer than 100 shares.
A 7 share trade and a 100 share trade count as one trade each.
But they obviously don’t represent the same number of shares.
And that creates a fascinating picture of modern markets.
In the most expensive stocks, the majority of individual trades could be smaller than a traditional round lot.
The “small” trade had become normal.
The SEC’s data makes the shift hard to ignore.
Market structure is full of definitions that sound permanent until the market changes underneath them.
What counts as a normal trade?
What counts as a meaningful quote?
What gets displayed?
What gets measured?
Sometimes the market evolves faster than the vocabulary used to describe it.
And that can make yesterday’s definition of a “small trade” look surprisingly large.
Show more
Before traders had screens, they had a strip of paper.
In 1867, Edward Calahan demonstrated a practical stock ticker that could transmit market quotations over telegraph lines and print them onto paper tape.
Thomas Edison later improved the technology.
The ticker changed something fundamental.
Market prices could travel much farther and much faster than before.
Information that once had to be physically carried could now move through a telegraph network.
And the problem has only become larger.
Today, prices move continuously.
News arrives instantly.
Charts update every second.
Algorithms react in milliseconds.
The trader is no longer fighting a shortage of information.
The trader is fighting an excess of it.
Peter Brandt has spent decades navigating that environment.
He has written about increasing market “noise” and has described deliberately limiting his attention to markets rather than watching them tick by tick. In one interview, he explained that he enters orders once a day and avoids getting glued to the screen because it can pull him away from his process.
That’s an important lesson for traders today.
The advantage isn’t necessarily seeing more.
It can be knowing what not to watch.
The ticker made information faster.
The internet made it instant.
Algorithms made it continuous.
The professional trader’s challenge is deciding what deserves attention before everything starts demanding it.
Show more

A trader can spend years improving a strategy… and still make it worse by adding one thing.
More rules.
A new filter for every losing trade.
Another indicator.
Another confirmation.
Another condition.
Another exception.
Eventually, the strategy becomes so complicated that the trader no longer knows which part is actually producing the edge.
This is a problem far beyond trading.
In statistics, adding enough variables can make a model fit historical data extremely well while making its performance worse on new data.
That’s overfitting.
Trading systems can suffer from the same problem.
A rule that explains yesterday perfectly may have nothing to do with tomorrow.
The dangerous part is that complexity can feel like sophistication.
More conditions can make a strategy look more intelligent.
But every additional rule is another assumption about how the market is supposed to behave.
And markets have a habit of changing.
The goal of a trading system isn’t to explain the past perfectly.
It’s to remain useful when the past stops repeating.
Show more












