
ChandlerGuo 郭宏才 宝二爷
@ChandlerGuo
bitcoin will 500000 in next 4 years 我微信号13935402564 我没有小号 所有QQ 钉钉 私信让你投资的都是诈骗 见到直接举报
Joined August 2012
2.9K Following 195.4K Followers
Bitcoin Distribution Pie Chart Analysis (Compressed Version)
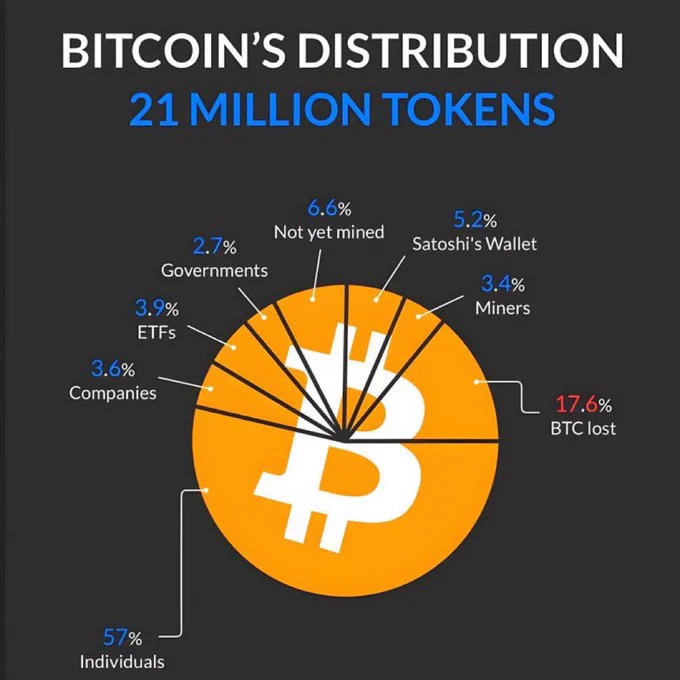
The pie chart depicts Bitcoin’s 21 million BTC supply distribution as of late 2024. Data sources include Binance Square and financial reports. It categorizes ownership into eight segments. Below is a concise breakdown, with percentages, absolute BTC (calculated as % × 21M), explanations, and implications. Percentages sum to 100%. Effective circulating supply: ~75.8% (~15.9M BTC), excluding lost and unminted.
Key Categories (Descending Order)
1Individuals: 57% (~11.97M BTC)
Retail holders in personal wallets. Implies decentralization but whale risks. Calc: 0.57 × 21M = 11.97M.
2BTC Lost: 17.6% (~3.7M BTC)
Inaccessible due to lost keys or errors. Boosts scarcity; stresses key security. Calc: 0.176 × 21M = 3.7M.
3Not Yet Mined: 6.6% (~1.39M BTC)
Remaining unissued rewards, mined gradually until ~2140. Ensures predictable supply. Calc: 0.066 × 21M = 1.39M.
4Satoshi’s Wallet: 5.2% (~1.09M BTC)
Dormant coins of Bitcoin’s creator. Adds mystery; potential volatility if moved. Calc: 0.052 × 21M = 1.09M.
5ETFs: 3.9% (~0.82M BTC)
Spot ETFs like BlackRock’s. Enables mainstream access; centralization concerns. Calc: 0.039 × 21M = 0.82M.
6Companies: 3.6% (~0.76M BTC)
Corporate treasuries (e.g., MicroStrategy). Validates as hedge; ties to business cycles. Calc: 0.036 × 21M = 0.76M.
7Miners: 3.4% (~0.71M BTC)
Held by mining firms. Supports network; sales impact supply. Calc: 0.034 × 21M = 0.71M.
8Governments: 2.7% (~0.57M BTC)
Seized assets (e.g., U.S. from busts). Adds legitimacy; regulatory risks. Calc: 0.027 × 21M = 0.57M.
Implications
•Decentralization: Individuals dominate (57%), but institutions (~13.6%) grow, risking centralization.
•Scarcity: ~24.2% out of play drives value.
•Trends: Captures 2024 institutional surge post-ETF approvals.
•Data Notes: Based on on-chain estimates; lost/Satoshi figures approximate.
July 2025 Updates
Chart from 2024; shifts include:
•Unmined: ~5.3% (~1.11M BTC).
•Lost: 11-18% (2.3-3.7M).
•Satoshi: ~5.2% (~1.1M).
•ETFs: ~6.2% (~1.3M, $158B).
•Companies: ~4.1% (~0.86M); MicroStrategy leads (0.6M).
•Miners: ~0.5% public (~0.11M), total higher.
•Governments: ~2.2% (~0.46M); U.S. ~0.2M.
•Individuals: ~52-53%.
Institutions rising; overall aligns with chart. (Word count: ~450)
Show more
0
0
2
3
0