Search results for AgentEngineering
AgentEngineering community
One keyword maps to one global community path.
People
Not Found
Tweets including AgentEngineering

Starting to hire and retrain for new agent engineering roles for *internal* functions to help get more powerful agents working well on critical business processes. I expect this type of role to be a very big deal over time at Box and other companies.
It looks something like an internal FDE, whose job it is to wire up internal systems and get agents working with them effectively. The person will be extremely technical and capable of building secure, governed agents for internal workflows that connect to business systems (like Box, Salesforce, Workday, etc.), and codify workflows in skills.
In some cases this person may understand the business process well enough to do it fully, but in most cases I expect them to work with the business directly in an embedded fashion. Ironically, that may introduce another new role on the business side that is more akin to agent product management for internal processes. The key is that you need technical + process people that can span multiple teams or functions in an organization. It’s not about brining automation to a job, but bringing automation to a process.
This is going to be a very big trend in most companies going forward. Fun to watch the early innings of what this will look like.
Show more

🔍 A DeepSeek Harness Plugin That Lets AI Explain the Agent's Own Trace
Less than two weeks after DeepSeek Harness entered developer preview, its plugin ecosystem is already taking shape.
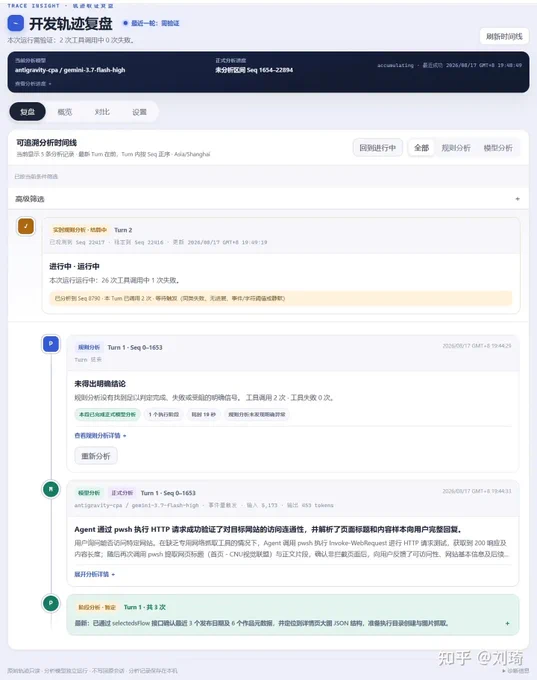
Zhihu contributor 刘琦 built DSH Trace Insight, a focused plugin for one of the most important but overlooked parts of Agent engineering: understanding what an Agent actually did.
1️⃣ DeepSeek Harness exposes the process
Many Agent harnesses behave like black boxes. Users provide a task, wait, and eventually receive an answer.
DeepSeek Harness is different. Its trace records tool calls, execution steps, failures, retries, and other intermediate activity.
This makes the Agent more transparent, but the raw trace is stored as a large JSONL file. Even with filtering, it is difficult for a human to read and reconstruct the full process.
The author's idea was straightforward:
If the trace is too complicated for humans, let another AI interpret it.
2️⃣ Turn raw traces into readable analysis
DSH Trace Insight adds a side panel that asks an AI model to explain the running trace.
It can summarize:
🔹 What the Agent is doing
🔹 Which methods and tools it used
🔹 Where errors or retries occurred
🔹 Whether any risky actions appeared
🔹 What lessons can be extracted from the run
Instead of waiting beside an opaque progress indicator, users can inspect how the task is progressing, whether the approach is working, and how risky the current behavior looks.
The goal is not to add another capability to the executing Agent. It is to add an interpretability layer around the Agent's behavior.
3️⃣ Use two models for cross-checking
When a suspicious step appears, the plugin can send the same trace to two different AI models and compare their analyses.
This is useful because trace interpretation is still a model-generated judgment. A second model can expose disagreements, missed risks, or different readings of the same tool call.
The plugin can also organize detected issues into a compact list for manual review.
That creates a useful three-layer workflow:
Agent execution → AI trace analysis → human review
It is a lightweight approach to Agent observability without requiring users to inspect thousands of raw log lines.
4️⃣ Installation is intentionally simple
The plugin is open source under the MIT license:
Users can ask their Agent to install it directly with:
Please install this DSH plugin:
The current version is designed for the native DeepSeek Harness Web UI.
Using it inside third-party desktop wrappers may require additional development, since those clients may package or modify the original Web UI differently.
5️⃣ DeepSeek Harness can become a model worker behind Codex
The author also suggests an interesting setup for people who do not use DeepSeek Harness as their primary Agent interface.
Open the native DSH Web UI inside Codex's browser. Codex remains the main harness, while it operates DeepSeek Harness and the models connected to it.
This creates a layered workflow:
🔹 Codex handles planning and orchestration.
🔹 Lower-cost non-GPT models inside DSH perform lightweight tasks or code inspection.
🔹 DSH Trace Insight exposes how those models executed the work.
🔹 Codex can discuss the results with DSH across multiple rounds, then send the final conclusion to another strong model for an additional review.
Compared with assigning every subtask to an expensive model, this setup can reduce cost. Compared with calling another CLI tool blindly, it provides much better visibility into execution.
✅ The real value is observability
DSH Trace Insight does one thing: it translates an Agent's raw execution history into something humans can understand.
That simplicity is its strength.
As Agents begin running longer tasks with more tools and greater autonomy, the important question is no longer just whether they produced the correct answer.
We also need to know how they reached it, what failed along the way, and whether they crossed any risky boundaries.
🔗 Full Reading:
#DeepSeek# #DeepSeekHarness# #AIAgents# #AgentObservability# #OpenSourceAI# #AIEngineering#
Show more




🎓 New in our LangSmith Essentials course: A capstone
We’ve added even more opportunities to apply your debugging and tracing skills, and for you to master our framework agnostic agent engineering platform for observing, evaluating, and deploying agents.
Get started at LangChain Academy today ⤵️
Show more

These days it feels like everything is “agentic”, but what does it actually mean to build an agent?
In this free LangChain Academy course, you’ll learn agent engineering from the ground up, covering foundational concepts like react loops, MCP servers, and human in the loop as you go.
Check it out:
Show more


Our 2nd founder dinner in SF co-hosted by @jerryjliu0 and @GuangyuRobert at @Fundamental - the team behind @tryshortcutai Talking about existing moats in the AI era.
Frontier labs are moving past model APIs into vertical agents - ChatGPT Health, Claude for Legal.
So where does the moat sit now?
✅ Agent engineering
✅ Infra optimization
✅ Domain evals and data
✅ Workflow expertise
✅ GTM and brand
If you're a founder or CTO shipping agents in production and want to know what other teams are doing to maintain their moat. Request a seat 👉️
Show more

Whether it’s existing consulting firms, new ones that emerge, FDEs from agent vendors, or new internal agent engineering roles, the amount of work that is going to be created to implement agents in enterprises will exceed anything we imagine today.
The complexity of implementing agents in any existing organizations is very real. When I talk to large enterprises, as you move from a chat paradigm to agents that participate in meaningful workflows, there are a number of things they need to do.
First, you have to get agents to be able to talk to your data securely across your systems. In many cases, enterprises have decades of legacy infrastructure that contain the valuable context for AI agents. That’s going to take a ton of work to go modernize and move to systems that work well with agents.
Then, you need to ensure that you’ve implemented agents with the right access controls and entitlements, the right scopes to be safely used, and have ways of monitoring, logging, and securing the work that they do.
Next, you need to actually document the processes in the organization in a way that agents can utilize for doing the work. You also need to figure out what the new workflow looks like when agents and people are working together on a process, and who steps in where. Just replicating the old workflow will mute the gains. Oh and you likely need to create evals for your top new end-state processes.
Finally, you have to keep up with a rapidly changing set of best practices and architectural shifts happening in the agent space. While it’s fun for people to change their personal productivity tools on a dime, it’s 100X harder to do this in a business process. The speed of change is a blessing and a curse right now for anyone trying to keep a stable system design.
All of this means that individuals and companies that develop expertise on the above set of components (and more) are going to be needed to help organizations actually implement agents at scale. This is also the rationale for vertical AI agents right now that can go in deep on a business domain and help bring automation to it.
This is a huge opportunity right now whether you’re doing this internally or as an external business provider.
Show more

it's officially day 1 of New York Tech Week! 🥳
We’re kicking off the week with the opening party hosted by gamma and a16z, alongside the a16z speedrun pitch day. Today’s lineup features tracks from ibm, deel, fenwick, pwc, vonage, and cloudflare, plus sessions with stripe, slack, and microsoft.
here’s what’s happening on day 1:
a16z & friends
• 4:00 PM - Pitch Day (a16z speedrun)
• 6:00 PM - Supper Club (Stripe x a16z)
• 6:30 PM - Kickoff Party (Gamma x a16z)
early morning & resets
• 7:00 AM - Park Run (off labs)
• 8:00 AM - Agents Meet (Walnut AI)
• 8:30 AM - TechWalk (TechWalk)
• 9:00 AM - House Mixer (Mercury)
• 10:30 AM - Cafe Kickoff (Kamp)
ai labs & tech giants
• 10:30 AM - Quantum Computing (IBM)
• 11:00 AM - AI PopUp (ElevenLabs)
• 12:30 PM - AI Voice Lunch (Vonage)
• 12:30 PM - Generative Computing (IBM)
• 2:00 PM - Agent Engineering (IBM)
• 3:30 PM - Context Engineering (IBM)
• 4:00 PM - Kickoff (Deel)
• 4:00 PM - AI Hypergrowth Hack (Mostest)
• 5:00 PM - Multi-Model Workflow (Cloudflare)
• 5:00 PM - AI at Work (Slack)
• 5:30 PM - Rooftop Cocktails (IBM x Tech:NYC)
• 7:00 PM - AI Founders (Microsoft)
venture capital & pitch showcases
• 9:30 AM - Women in AI (Fenwick)
• 11:00 AM - Investor Lunch (Actuate)
• 11:30 AM - Series A Raising (SVB)
• 1:00 PM - AI Vibe-Coding (Mucker)
• 2:30 PM - Search Panel (Mucker)
• 2:30 PM - AI Finance Lunch (PwC)
• 4:00 PM - M&A Panel (TRV x AWS)
• 6:00 PM - Venture Night & Pitch (UATech)
deep tech, defense & industry
• 3:00 PM - Defense Panel (VC in DC)
• 4:00 PM - US Manufacturing (Orrick)
• 5:00 PM - RL Workshop (Adaptive ML)
• 6:00 PM - Robotics Software (NY Robotics)
full schedule at
follow @techweek_ for live updates on New York Tech Week!
Show more


Introducing Z Code: From Vibe Coding to Agentic Engineering.
Z Code is a new kind of Agentic Development Environment (ADE). Not another IDE with a chatbot — a cockpit where Claude Code, Gemini CLI, and Codex work together in one workspace.
⚡ Multi-Agent Framework — switch between Claude, Gemini, and Codex mid-project, zero friction.
📱 Dual-Device Sync — connect your phone to your desktop agent via QR code. Code on the go, real-time.
🧠 Multi-Provider Support — OpenAI, Anthropic, Google, DeepSeek, Bigmodel, and more. One interface, all engines.
Powered by GLM-5 — 744B params (40B active), open-source SOTA, MIT license.
Download Z Code:
Try GLM-5:
Weights:
Coding Plan:
#ZCode# #GLM5# #AgenticEngineering# #ADE#
Show more


