
DefiLlama.com
@DefiLlama
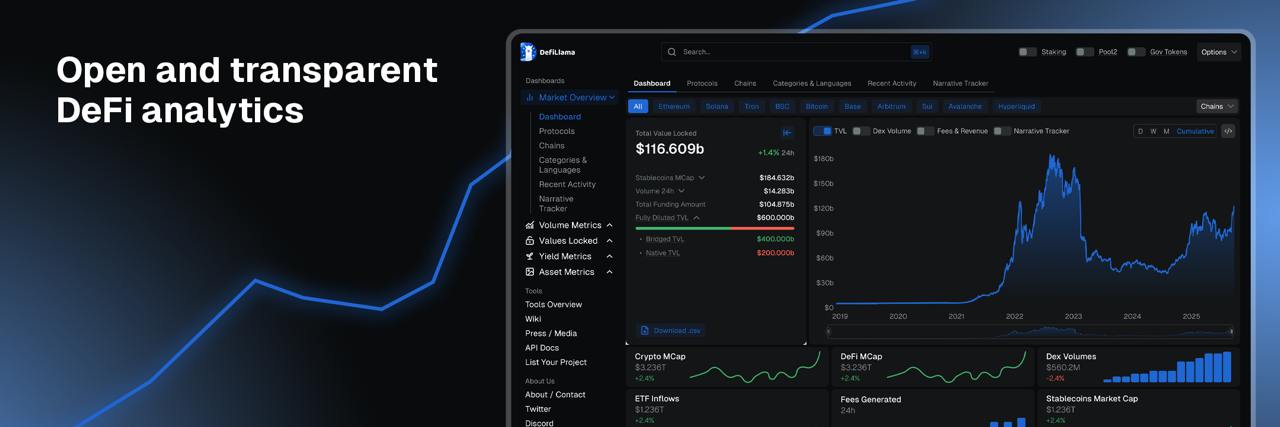
Open and transparent DeFi analytics.
For support:
3 Following 370.9K Followers
Chains that set up Enterprise dashboards on DefiLlama get a dedicated tab on their listing with custom charts, metrics, announcements, and links.
Pictured here for Flare.

The top 10 DeFi protocols by revenue brought in over $300M combined over the past 30 days.

Which exchanges list your favorite tokens?
The "Token Finder" on DefiLlama's new Exchange dashboard lets you filter to exchanges that list up to 8 tokens.

RWA Perps Open Interest has grown from barely existent a year ago to over $16B today.

Investor Relations and Enterprise dashboards on DefiLlama are now visible on the pages of their associated protocols.
Pictured here for our inaugural investor relations partner, Spark.
Show more


The new Find My Exchange tool on @DefiLlama scores more than 50 exchanges, both centralized & decentralized, on a 0-100 scale built from four pillars:
> Reserves
> Execution
> Activity
> Liquidity
Only one made it to S-tier (85+), and only one DEX reached A-tier (70+).
Find out more about the REAL scoring system and everything else Find My Exchange can do in this article:
Show more

We're hosting our 2nd ever event in Singapore for Token2049!

We're hosting a DefiLlama event in Singapore for Token2049
Our previous event got oversubscribed by 5x, so get in now before we fill capacity
For 'Who invited you?' just write '0xngmi' so we know you're coming from my tweet
Show more

This prompt will change how you do crypto research. Paste it into DefiLlama's LlamaAI to find trending tokens, assess their fundamentals, check for red flags, and look up what people are saying about them.
Find tokens trending in the last 24-48 hours using at least two independent signals: news/narrative mention spikes against baseline, price/volume/mcap movers, and X mention volume with sentiment. Require corroboration across at least two signals per token, and note which signals flagged each one. Return 8-12 candidates, spread across categories rather than one narrative dominating the list. Separate large-cap tokens (top 100 by market cap) from smaller or emerging ones, since "trending" means something different for each.
Before pulling any fundamental figures, resolve each candidate's identity precisely: confirm whether it is a chain-native token, a protocol fee/governance token, or a token with no underlying protocol at all. If a symbol has more than one live contract, identify which one the trending signal actually refers to before analyzing anything. If the correct contract cannot be established with confidence, do not publish fundamentals for it: drop it from the ranked table and list it separately as identity-unresolved, with what would resolve it.
For each resolved candidate, state in one sentence what the project does, its category, and its chain(s).
Assess fundamentals only where they exist:
- Price, market cap, fully diluted valuation, and the gap between them
- For protocol or chain tokens: TVL, fees, revenue, and price-to-sales / price-to-fees ratios against category peers
- 7-day, 30-day, and 90-day price and volume change, checked against TVL/fee change over the same windows, to separate price-driven moves from usage-driven ones
- Any unlock cliff in the next 30-90 days and its size relative to circulating supply
- Universal Token Rating, if the token has one
For tokens with no protocol behind them, skip the fields that do not apply and say so rather than forcing a number in.
Assess social activity separately from fundamentals:
- Mention volume trend and sentiment direction on X over the past 24-72 hours
- Whether a small number of accounts are driving most of the volume, or it is broad-based
- Whether social attention is rising faster than, in line with, or behind the fundamental data above
Check for red flags before writing a verdict: concentrated holder base, a recent large unlock already sold into the market, known contract or audit issues, and any active exploit or governance dispute. When two sources disagree materially on a red-flag figure, say which one you trust more and why, or mark the figure unresolved-conflicting; never present two contradictory numbers as if either could be picked at random.
Write one row per token: name, category, what triggered the trending flag, the fundamental read, the social read, red flags found, and a verdict. Use one of four verdicts, each tied to a rule: fundamentally-backed (usage or fees moving with price), narrative-led (social and price moving, fundamentals flat), unlock-risk (fundamentals fine, but a near-term unlock threatens the float), or unverifiable (identity or data conflict prevents a real read, distinct from identity-unresolved candidates already excluded above). Rank by verdict strength, not by how hard a token is trending. State the source next to every figure.
If you chart price changes across the candidate set and one token's move is an order of magnitude larger than the rest, exclude it from that shared chart (or give it a log-scale or separate chart) so the other bars stay readable; keep the number in the table regardless.
Close by naming the two or three tokens most worth a deeper look, and for each, the specific data point that would confirm or kill the thesis.
Show more

Four of the last eight DeFi protocols that tried to pull liquidity from an established competitor (see: vamp attack) still held it three months later. Four didn't.
@Motoswap became another entry in that dataset, launching on Ethereum recently with $6M in volume and $5.7M in new TVL in its first 24 hours.
Full breakdown of the eight historical vamp attacks and the 100M MOTO (10% of total supply) riding on Motoswap's own strategy:
Show more

DefiLlama Pro dashboards are now optimized for DeFi teams to use together.
Ideal for teams that want to use DeFi data in an internal analytics dashboard or to collaborate on building custom charts together.
Show more

Introducing team dashboards on DefiLlama.
- Private: visible only to your team
- Collaborative: edit together in real time
- Organized: everything in one shared workspace

We've updated our Open Interest methodology to account for protocols that count both the long and short side of contracts in their official numbers.
Now, all protocols are standardized with OI only counted 1X.
Show more

Introducing team dashboards on DefiLlama.
- Private: visible only to your team
- Collaborative: edit together in real time
- Organized: everything in one shared workspace
DEX share of spot volume is on a multi-year uptrend, climbing from 12.5% in 2024 to over 20% in many recent months.

Arc Mainnet is now live on DefiLlama.
8 protocols listed with over $300M in total TVL.

"Data source: DefiLlama"
DefiLlama is cited 6 times in a new paper from the ECB: "DeFi-ying the Fed? Monetary policy transmission to stablecoin deposit rates"


.@SentoraHQ's PST Vault by the numbers:
• TVL grew 8x from $5.4M →$43M in just 3 weeks
• Average APY held steadily at 8%
• Transparent and verifiable onchain
Proof of real yield
We just created a new metric for exchanges: realized perp slippage
1. We take a snapshot of the orderbook right before market orders execute
2. Calculate the slippage at which it should fill ($0.94 on Binance)
3. Compare against actual slippage on the fill (actually $1.63)
Show more

Which exchanges have your tokens? Which work in your country? What are the fees?
New on DefiLlama: Find My Exchange
50+ exchanges compared on costs, slippage, liquidity & volume. Advanced filters, token finder, and detailed per-exchange pages.
Show more

TradFi markets are red today outside the Energy sector.
Chart from the DefiLlama equities dashboard.

The biggest update to DefiLlama's dashboard editor ever. Building and customizing dashboards is now more intuitive and faster.
Some highlights from the new version our llamas cooked:
1) Quick add: cmd+k in edit mode, type "uniswap fees" or "aave vs compound revenue" and the card is added
2) Parameters: dashboard level chain / protocol switch in the top bar, all connected cards update; build one dashboard and use it for multiple protocols or chains
3) Sections and tabs: group cards into collapsible sections or split the dashboard into tabs
4) Custom data: upload CSVs and chart them
ui polish kit for the whole dashboards area
5) Hover tooltips sync between charts, add annotations, and more
Reminder that you can create one custom dashboard for free:
Show more












