Ariston
@Ariston_Macro
Global macro trader. Commodities, FX, equities & crypto. Systematic signal provider to multiple sovereign wealth funds & dozens of $1B+ AUM asset managers.
806 Following 15.7K Followers
As I pointed out before the selloff began, regardless of how things play out, we are indeed seeing signs of a top forming in crude oil.
Price may find some temporary relief between the 20-day and 50-day moving averages. There will likely be plenty of headlines around this area.
For those who positioned short ahead of the volatility expansion, this could be a good place to take some profits and wait comfortably to see how things play out.
Show more


Great, now whoever was in charge of trading this crude oil crush that was so obviously orchestrated and executed since Friday can close his shorts and bring home ~100m$ - Nice one by the way
Show more


SOX price action during the dot-com era has predicted almost every swing low and swing high for us since SOX topped in June.
And $SOXX generational resistance line since the GFC has also marked multiple swing highs and lows over the past few months.
"This time is different."
No, it's not.
It's all just the same thing, over and over. We can't help ourselves.
And you and I can't control it, or stop it, or even slow it, or even ever so slightly alter it.
We just react.
And we make a lot of money if we get it right, and we get left by the side of the road if we get it wrong.
Show more


#科创50# Down ~25% since the bearish flip. Keep this in mind: don’t go long within a descending channel when the structure is bearish. You’ll find it makes life much easier for both your account and your equity curve.
Show more

If yields peak here, will we see a repeat of 2022? What do you think?

SK Hynix structure update: T1 for the earlier short was 1,319k. You’ll notice this is also the confirmation level for a daily double bottom. The key is that the T1 target was set on October 7, before the market subsequently formed a double bottom here. Understand that market structures are created by people. This is where many chart traders fall short: they trade patterns without considering how those patterns came about.
On October 21, a Failed Breakout signal triggered and the structure turned bullish. On October 23, Ariston Bottom triggered a predictive bottom signal, completing a three-part sequence supporting the relief rally. That sequence has now run its course. The key is whether price can firmly establish support above the 20-day cost line. The bullish structure’s invalidation level is marked on the chart; a break below it would trigger another leg down.
Show more

The #KOSPI# found precise support at the central trendline dating back to 2020 that we highlighted. It is now facing resistance at the 20-day average cost level.
Whether it can break above that level will determine whether this is a textbook dead-cat bounce—the starting point for another leg down—or whether it can rebuild a trading range here and rebound higher.
At this critical juncture, here’s an update on the market structure guiding our plan to go long Korea again...(The latest detailed market structure update is now available in the subscriber newsletter.)
Show more

Let’s take a broader perspective: The #KOSPI# is testing its weekly ascending trendline, defined by the initial advance and pullback that began in 2020. This line establishes the core slope of its multi-year uptrend and also forms the upper boundary of the current rally, making it critically important. @TimmerFidelity
Show more

$NXPI Price is hovering around the yearly moving average. A break above it would trigger another leg higher.

$IBM is a textbook example of trading within a rectangular range: on May 18, Ariston Bottom triggered a predictive bottom signal, after which the stock rallied to the upper boundary of the range.
On June 2, a Failed Breakout signal confirmed that the upside breakout had failed, followed by a predictive Ariston Top signal on June 3. The stock then fell to the lower boundary of the range.
On July 28, Ariston Bottom triggered another predictive bottom signal, and the stock has been rising since. Once it establishes support at this level, I expect it to return to the upper boundary of the range.
Show more


IBM CEO: "Demand across our portfolio combined with strong operational execution led to accelerated growth and solid operating pre-tax margin expansion in the quarter"
$IBM: +6% AH
Show more

Let’s take a broader perspective: The #KOSPI# is testing its weekly ascending trendline, defined by the initial advance and pullback that began in 2020. This line establishes the core slope of its multi-year uptrend and also forms the upper boundary of the current rally, making it critically important. @TimmerFidelity
Show more
Some novice traders don’t understand this, but these things do happen. If you’ve been around long enough, they’re no surprise—just history replaying itself in a different form.
As I’ve repeatedly written in my subscriber newsletter: “The first round of the election on October 4, a possible runoff on October 25, and the fiscal policies that follow are key drivers of the exchange rate. In 2014 and 2022, USDBRL fell after the first round, only to fully reverse those declines before the runoff. In 2018, the real reached its strongest level on the Friday before the runoff. So the first round can trigger large currency moves, but those moves may not last. Markets can turn quickly, and we must always be ready to turn with them and stay on the winning side.”
Anything can change in an instant. Only the magnitude of the move is predictable—for direction, listen to the market. For novice traders, this is a lesson you must learn. I hope this episode leaves it etched in your minds from here on.
Show more


Is this shaping up to be one of the biggest prediction market whiffs of all time?

Until gold breaks above the level needed to confirm a bullish reversal, I continue to favor selling rallies.
Although reserve managers have started buying following the recent breakdown, potentially cushioning steeper declines, gold remains in a sell-on-rallies regime.
The buying appears to be driven more by diversification needs than directional bullish conviction. Risk sentiment remains subdued even after France avoided a downgrade, reinforcing the bearish bias.
Show more

Palladium: Down ~20% since we went short.

自做空以来,白银已下跌逾~20%,并继续如预期沿下降通道运行。在下降通道内转为看跌后,行情自然会如此发展。
与此同时,白银/黄金比率也如预期一样继续走弱,并伴随贵金属价格下跌——正如之前讨论的那样,如果没有白银的确认和情绪支撑,黄金很难走出持续行情。关注价格结构,也要关注跨资产确认。这是宏观交易的关键。
Show more

Isn't it just majestic?

The buying has shifted back toward banks and defensives. This week's desk flows showed selling in Hong Kong technology, reversing last week's selective growth buying. China's September PPI rose 5.0% year on year, while core CPI held at 1.0%. Energy and raw materials drove much of the producer-price increase, leaving a widening gap between upstream price pressure and consumer pricing.
Show more

GS:Selling of Tech reached its highest notional value since June

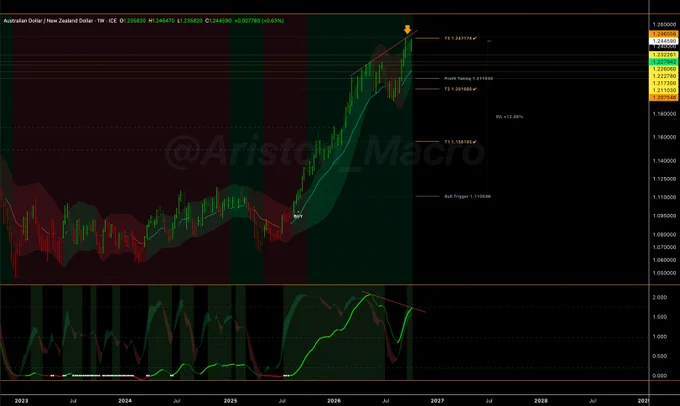
$AUDNZD: Last week’s divergence call has been confirmed, with price now falling into a descending channel on the daily chart. @AlexanderKim120

1/ Breman’s and Bullock’s views are clear. 2/ New Zealand’s QSBO points to a continuing economic recovery, while Australian consumer confidence fell 4.7% month-on-month in October, with broad-based weakness. 3/ NZD net long non-commercial futures positioning shows that the market’s previous bearish positioning has already been unwinding.
I’m considering flipping my AUD/NZD position from long to short, given that 1/ it has reached the extended upside target (T3), and 2/ momentum is diverging from price. September 22 may have marked the top. @AlexanderKim120
This reversal trade is an early move in the process of value discovery. We will gain support from the algorithm as the gold lines are broken to the downside one by one, with a break below the confirmation level above 1.20 ultimately confirming a potential larger-cycle reversal.
Show more
Silver has fallen more than 10% since we went short and continues to follow the descending channel as expected. This is what naturally follows a bearish turn within a descending channel.
Meanwhile, the silver-to-gold ratio has also broken down as expected, alongside the decline in precious metals—as discussed previously, gold struggles to develop a sustained move without confirmation and sentiment support from silver.
Watch price structure, but also cross-asset confirmation. This is key to macro trading.
Show more


Since we went short semiconductors & AI, $SOXS has gained 40%. Fools fight the trend; outstanding traders listen to the market and follow its lead.

Since the weekly report was published (reiterating the bearish turn on SOXX), the $SOXS perpetual contract is up 10%—and has gained 18% since the bearish signal was triggered.
Show more

I’m on the road, so just a brief update. The rebound attempt began precisely in the five-minute bar during which we posted (that bar was the first of the bulls’ counterattack on the minute timeframe, so we can say we were among the first market participants globally to notice this move). ( has now intensified considerably.
On the lower timeframe, bearish momentum has shifted into the “dotting” state, while the upper boundary of the four-hour channel currently sits above ... Once price enters the rising channel, the real battle will begin, potentially involving substantial capital on both sides.
$SOXL
Show more

Our prophecy was fulfilled on Tuesday as SPX delivered our expected new ATH. Breadth remains weak, as evidenced by RUT and DJI. The tape has grown weaker and weaker over the past few days despite the new ATHs. Cross-asset technicals and narratives are giving conflicting signs for U.S. equities. As yields hover around critical resistance, I expect a pullback is in order, which could cushion equities in the ST. As mentioned repeatedly, Trump only cares about 1) yields, 2) inflation prints, 3) stock market performance and 4) approval ratings. A push in any of these will support equities. However, the three key AI bellwethers are showing weakness, as SOXX failed to hold above the generational resistance and NVDA is once again back below 230. KOSPI is much worse: it has never been able to break through the 7.1K resistance and has dipped below the ST trendline. KOSPI is indicative of the typical run into the tulip stage of any bull run, and typically, as we have seen from its PA, it doesn't bounce back to key levels. Despite the ostensibly flattering tape on SPX and NDX, underneath I smell greed and chaos. Stay vigilant. I expect vol to pick up as we near the election.
Show more